Let's start with a simple curve graph and see step by step how to make it more accessible.
Why the accessibility of your dashboards is important : 5 tips to improve them
What is meant by the term "digital accessibility"?
"The power of the Web lies in its universality. Access for all regardless of disability is an essential aspect." Tim Berners-Lee, Director of the World Wide Web Consortium (W3C)
It is estimated that around 15% of the world's population is affected by accessibility issues, and 45 countries have anti-discrimination legislation. However, the principles of accessibility are not only intended for people with disabilities, each person may need more facility to understand a graphic.
In the tech world, accessibility means providing a digital experience that is suitable for everyone, where everyone can understand, navigate and interact without difficulty. This principle is already widespread on websites but is also important in data visualisation.
There are several types of disability:
- Visual
Although all forms of disability are important to consider when creating digital experiences, visual impairments are the most relevant when visualising data.
These moderate to severe visual impairments can be characterised by low vision, tunnel vision, colour blindness or even total blindness.
- Cognitive
This disability will affect the way in which people process information and will play on the difficulty of concentration, comprehension, thinking and memory among others. It is therefore important to provide as much information as possible so that reading is as easy as possible and requires as little brain effort as possible.
Although cognitive accessibility is originally intended for people with disabilities, it can be useful when the user shows signs of fatigue, or in other situations that may affect their faculties.
- Auditory
These users will have hearing impairments, from hard of hearing to deaf. When reading data visualizations, these people will not be as affected but should be considered if the graphic representation contains an explanatory video that requires hearing the sound.
- Physical
This disability, in the case of digital accessibility, represents people who cannot use the mouse as easily and have to move around the interfaces thanks to adapted keyboards or voice recognition for example.
So how can you be more inclusive when building your dataviz ?
The World Wide Web Consortium's (W3C) is an initiative that sets standards to ensure good accessibility practices on digital platforms.
Digital compliance based on the WCAG (Web Content Accessibility Guidelines) or RGAA (Référentiel Général d'Amélioration de l'Accessibilité), created in 1997 by the W3C, is based on the respect of technical, editorial and graphic criteria. This allows websites or mobile applications to be perceptible, usable and understandable for all users.
The important thing is not necessarily to be an expert on the subject but to be aware that not everyone is receptive to a graphic in the same way as its creator.
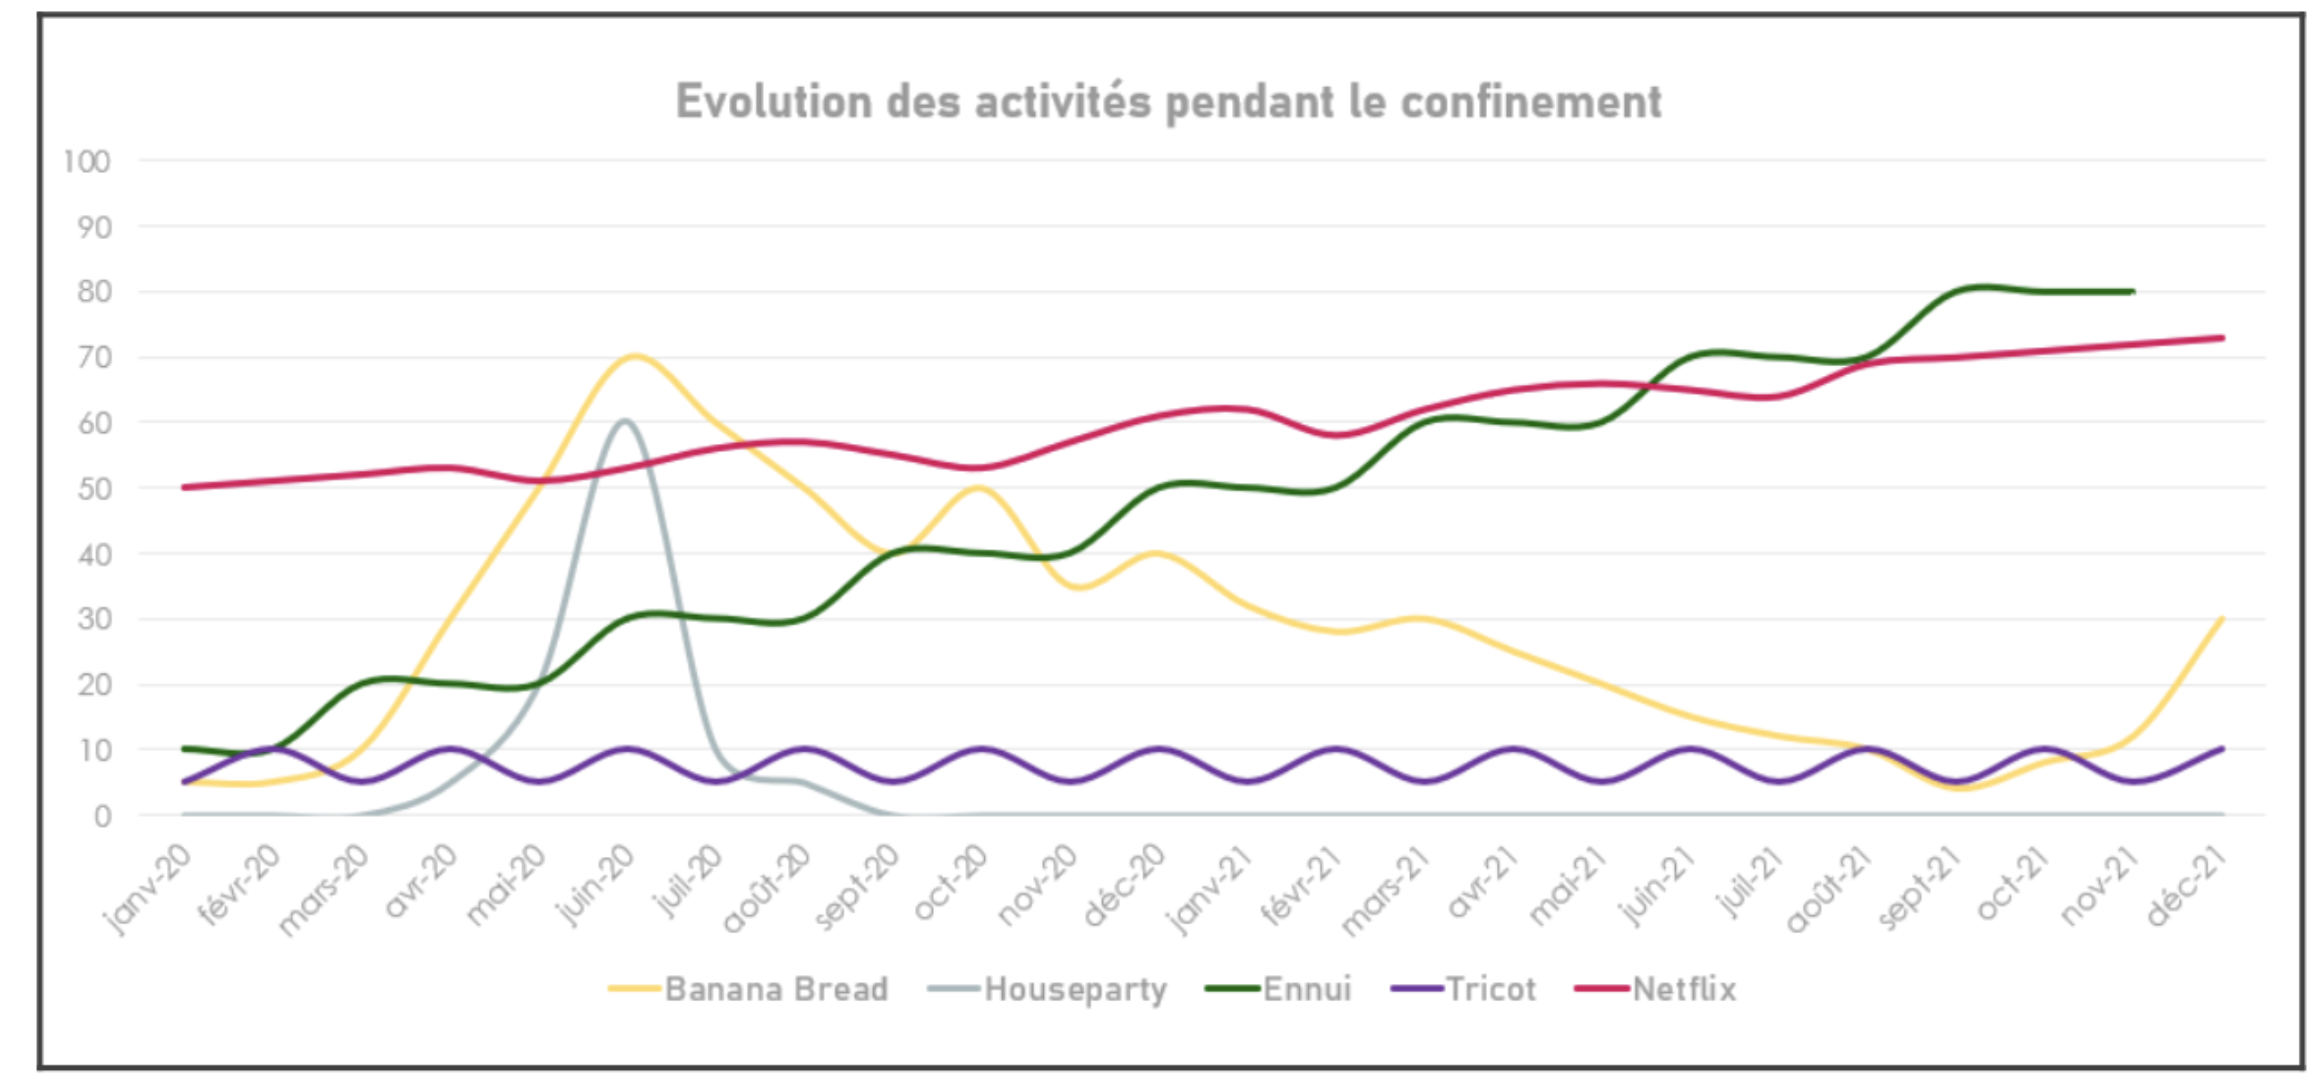
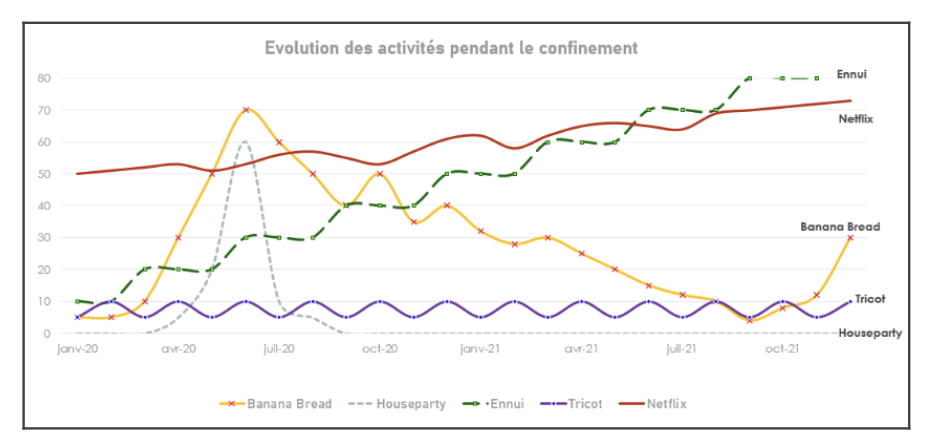
Let's start with a simple curve graph and see step by step how to make it more accessible.

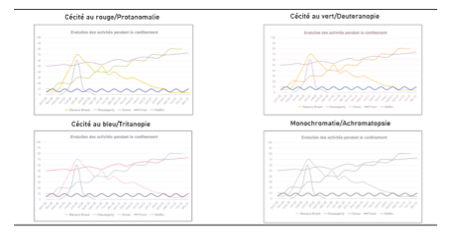
If you put yourself in the shoes of colour-blind people, then this seemingly unproblematic graph becomes a real challenge to understand the data.
Here are 5 steps to make your graph more accessible.
1. Check the colour contrast
Several palette generation sites such as Coolors have a feature to see if the chosen colour combination will be visible to people who cannot distinguish them clearly. The Color Blindness site is also an excellent tool for testing a visualisation or image by importing it directly into the platform.
Differentiating between two curves by colour intensity can be a quick and easy way to emphasise colours that are sometimes not very noticeable.
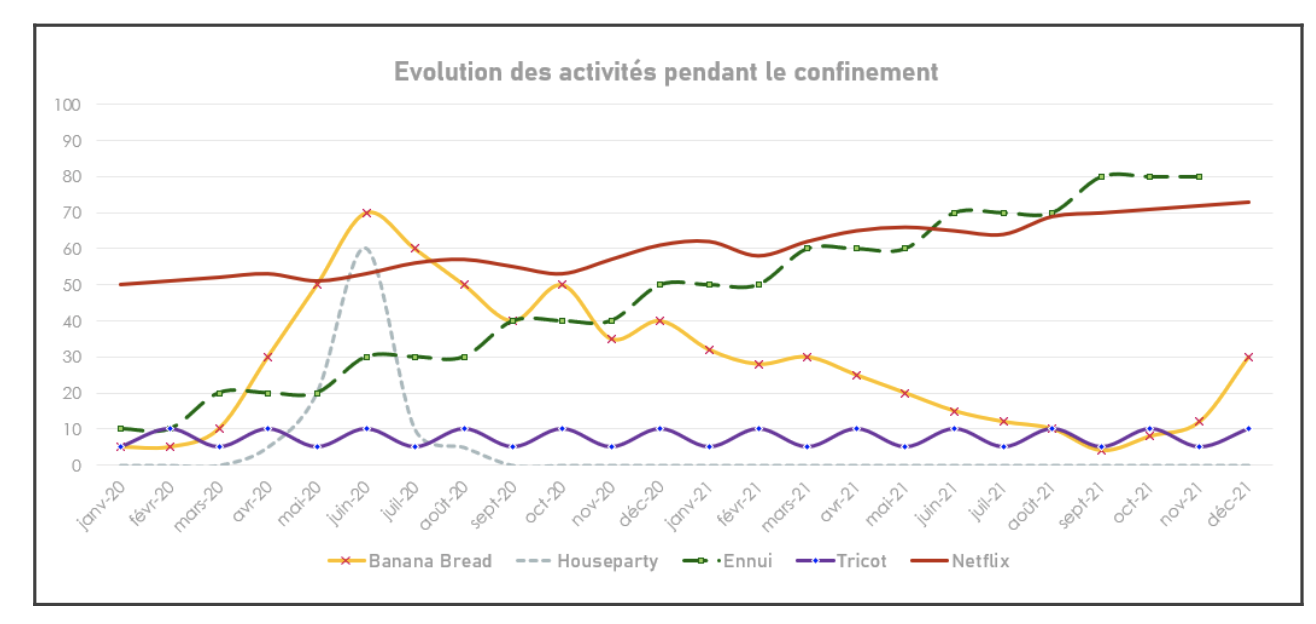
2. Don't just rely on colour
Colour is useful to enhance the visual appearance of a graphic but should not be relied upon entirely to convey key information. This principle is called "redundant encoding", which means using several different aesthetic dimensions to convey information.
A common example is the addition of marks to emphasise the difference from other curves.
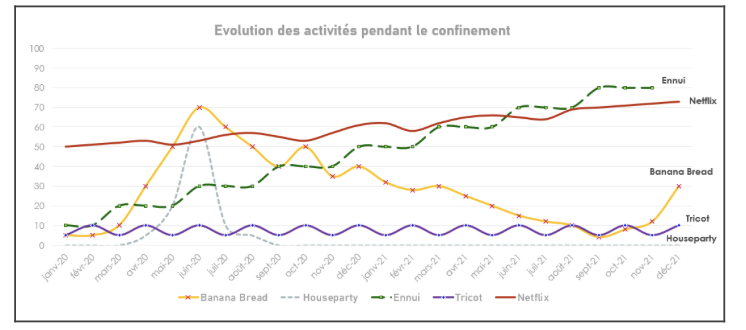
3. Labelling data
This point applies equally to people with cognitive or visual disabilities but also serves to reduce visual fatigue for everyone. This technique of labelling the data avoids excessive eye scanning and helps to make the data easier to understand.
It consists of adding the legend directly on the curve (in our example), either at one end or both if there is enough space.
4. Be generous with white space
Another principle recommended by W3C is the use of white space to reduce clutter, highlight relationships between content and make reading more enjoyable.
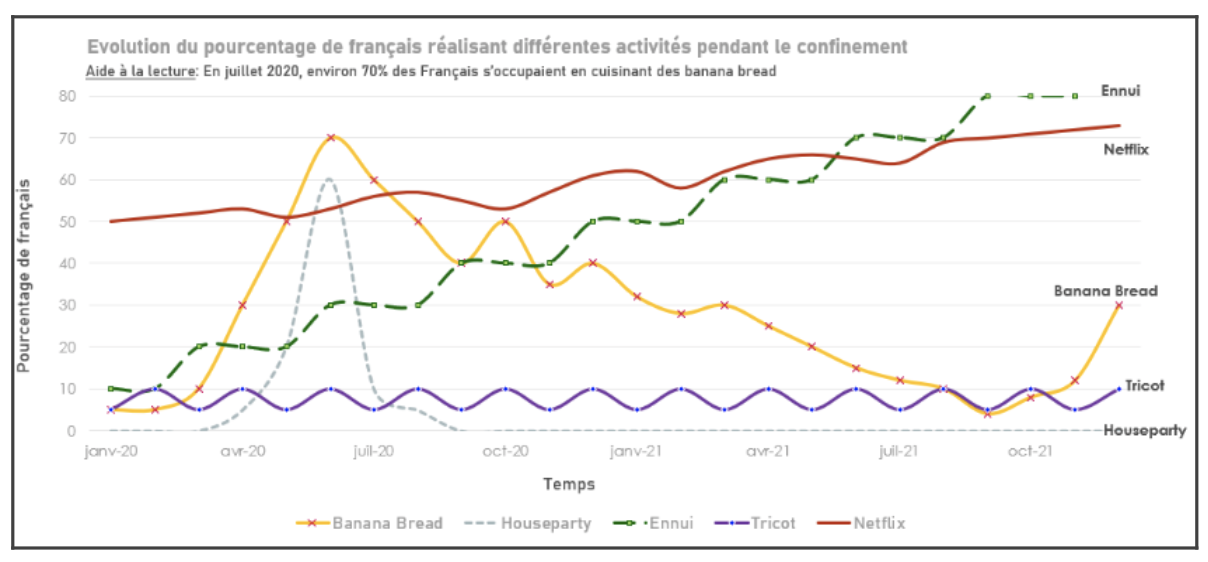
5. Facilitating reading
People with cognitive disabilities need more help to understand a visualisation. It is therefore important to be precise in the title of the graph and the axes and even add a reading aid to make the numbers speak for themselves.
And to facilitate reading for people with visual disabilities who need screen readers, it is also possible to add alt text, which will provide a descriptive explanation of the visualisation and allow a more complete understanding of what is being presented.
In our opinion, these 5 examples are an excellent start to familiarise yourself with the principle of accessibility in Dataviz. To go further, the W3C site presents a more exhaustive list of other good practices to apply.
As you can see, creating accessible visualisations takes a little more time, but once you get the hang of it, you'll notice the huge impact it will have on people with disabilities.
So, are you ready to revolutionise your dashboards ?